
How to Look Up Douglas County Jail Population Data
Population data for the Douglas County jail lives on the Sheriff's detention demographic statistics page. That page is the first official source for any current chart or custody snapshot tied to the Douglas County Detention facility at 4000 Justice Way in Castle Rock. The update cadence is set by the Sheriff's Office, and the page should be checked fresh each time because the chart format can change. National context comes from the Bureau of Justice Statistics. Douglas County budget documents fill in bed counts and funding context.
Three pieces of context help when reading the page. First, the figure shown is a jail count, not a prison count. Jail holds people awaiting trial, serving short county sentences, or held on warrants and writs. Prison is run by the state, and Colorado Department of Corrections numbers live at a different site. Second, the Sheriff snapshot is a county jail number for Douglas County only. Third, a one-day count is not the same as average daily population, and a snapshot may swing with arrest volume, bond hearings, transfers, and release timing.
Douglas County Jail Capacity Overview
Jail capacity is the count of beds the facility is rated to hold. Douglas County operates its detention facility at the Justice Center campus in Castle Rock. The Sheriff's Office is the official agency for jail, booking, custody, and detention data, and the facility shares a site with the courts. The official rated capacity for the Douglas County Detention facility was not located in the public sources reviewed for this build. The table below is structured to match the BJS rated-capacity framework, with the count marked as a research gap. The Sheriff's detention demographic page should be checked first if a current capacity figure is needed.
| Facility | Address | Rated Capacity | Current Population |
|---|---|---|---|
| Douglas County Detention / Justice Center | 4000 Justice Way, Castle Rock, CO 80109 | Not located in official sources | Not located in official sources |
Two notes on bed counts. Rated capacity is the number the facility is built and staffed to hold. Confined population is the head count on a given day, and it can run under, at, or over rated capacity. The gap between the two drives local policy talk about new beds, transfers, or pretrial release. The only count that should be cited for Douglas County is the figure on the Sheriff's own page or in a county budget document.
Douglas County Jail Average Daily Population
Average daily population, or ADP, is the mean number of people held in the jail across a set period. BJS uses ADP as a core measure because a one-day count can swing for reasons that have nothing to do with long-term policy. A bond docket, a weekend booking spike, or a transfer bus to state prison can move the daily count without changing the trend.
The Sheriff's detention demographic statistics page is the place to look for the most recent Douglas County ADP figure. A year-over-year change between two ADP values is the cleanest local trend signal. A precise Douglas-specific ADP was not located in the public sources pulled for this build, so a number is not invented here.
Douglas County Jail Demographic Breakdown
Demographic data shows who is held in the jail at a given time. Standard splits cover sex, age band, and race or ethnicity. BJS publishes national jail demographics each year, and the Sheriff's demographic statistics page is the source for local figures. The Sheriff page should be checked for the current chart because the layout and the year span can change. Specific Douglas County percentages were not pulled in this build, so the table is left as a structure with the source noted rather than filled with invented values.
| Group | Percent of Population |
|---|---|
| Male | See Sheriff demographic page |
| Female | See Sheriff demographic page |
| Adult (18+) | See Sheriff demographic page |
| Race and ethnicity bands | See Sheriff demographic page |
The Sheriff's Office under Sheriff Darren Weekly runs the demographic stats page and is the right channel for a current figure or an open records request if a detail is not on the page. The Sheriff records request page at dcsheriff.net/records is the formal route. A short note for users reading the chart: a one-day demographic snapshot is not the same as the demographic share of all admissions during a year, and BJS reports both kinds of cuts at the national level.
Douglas County Pretrial vs Sentenced Jail Population
One of the most useful cuts of a jail count is the split between people held before trial and people serving a sentence. Pretrial holds cover people who could not post bond, who have a no-bond hold, or who are held on a warrant or court order. Sentenced holds cover people serving short county sentences after a guilty plea or verdict. The split matters for budget talks, bond reform talks, and court backlog talks. National BJS reports show pretrial detainees often make up the majority of local jail populations.
| Status | Percent |
|---|---|
| Pretrial | Not located in official sources |
| Sentenced | Not located in official sources |
The Douglas County pretrial and sentenced split was not located in the public official sources pulled for this build. The Sheriff demographic page should be checked first. If the figure is not posted, a CORA request through Douglas County or a Sheriff records request can be used to ask for a recent snapshot.
Douglas County Misdemeanor vs Felony Jail Population
The charge mix breaks the jail count by the most serious charge held against each person. In Colorado, misdemeanors and county-level cases move through the County Court, while felonies, domestic relations, and larger civil cases move through the District Court. Both court tracks can produce people held at the Douglas County Detention facility. Felony holds, no-bond holds, and serious domestic violence holds often run longer than low-level misdemeanor holds, so even a small share of felony holds can take up a large share of the bed count on a given day.
A precise Douglas County misdemeanor and felony split was not found in the public official sources pulled for this build. The Sheriff detention demographic statistics page is the right place to check for a current chart. Court case mix data for the 23rd Judicial District is tracked by the Colorado Judicial Branch and can give a side view of the felony and misdemeanor case load that feeds the jail.
Mental Health and Medical Jail Population in Douglas County
Jails hold a share of people with active mental health, chronic medical, or substance use needs. National BJS work has tracked this share for years and shows it is a real cost driver for county budgets. Intake at the Douglas County Detention facility includes medical and mental health screening, and classification can route people to housing units with more support.
Specific Douglas County figures for the share of the jail population on a mental health or medical caseload were not pulled in this build. Douglas County budget documents and the Sheriff's annual reporting are the right places to look. Court diversion programs in the 23rd Judicial District can also affect the count by moving people out of pure jail beds.
National and State Context
National context comes from the Bureau of Justice Statistics, which publishes the main federal jail inmate reports and sets the terms used here. BJS reports a national jail rate per 100,000 residents each year. A Colorado state rate is also tracked through BJS. A Douglas County rate per 100,000 would use ADP as the numerator and county population from Census QuickFacts for Douglas County as the denominator.
BJS is the right source for the most recent national and state numbers, since the figures shift year to year. The Census QuickFacts page is the right denominator for any per-100k math at the county level.
| Level | Jail Population per 100k |
|---|---|
| Douglas County | Research gap; compute from Sheriff ADP and Census QuickFacts |
| Colorado | See most recent BJS jail inmate report |
| National | See most recent BJS jail inmate report |
Lead-in for the BJS image below: the Bureau of Justice Statistics homepage links to the national jail and prison inmate report series used as the framework for this page.
BJS gives the national rate, the definitions, and the trend data that frame any local Douglas County jail figure in context.
Douglas County Jail Population Trends Over Time
Trend data shows how the jail count moves across years. A multi-year line tells more than a one-day count because it filters out short swings from arrest spikes, weekend bookings, or a single transfer bus. National BJS jail counts saw a sharp drop in 2020 during the early pandemic period and a partial rebound in later years. The Douglas County trend across the same window would need a multi-year ADP table from the Sheriff or from county budget materials. That multi-year Douglas table was not pulled in this build, so a specific local trend line is not stated here.
Several local factors push the trend up or down over time. Population growth along the I-25 corridor adds residents, drivers, and call volume. Bond practice, court backlog, state prison transfer timing, and probation hold counts all touch the bed count.
Lead-in for the Census image below: Census QuickFacts for Douglas County is the source for the county population denominator used in any per-100k jail rate.
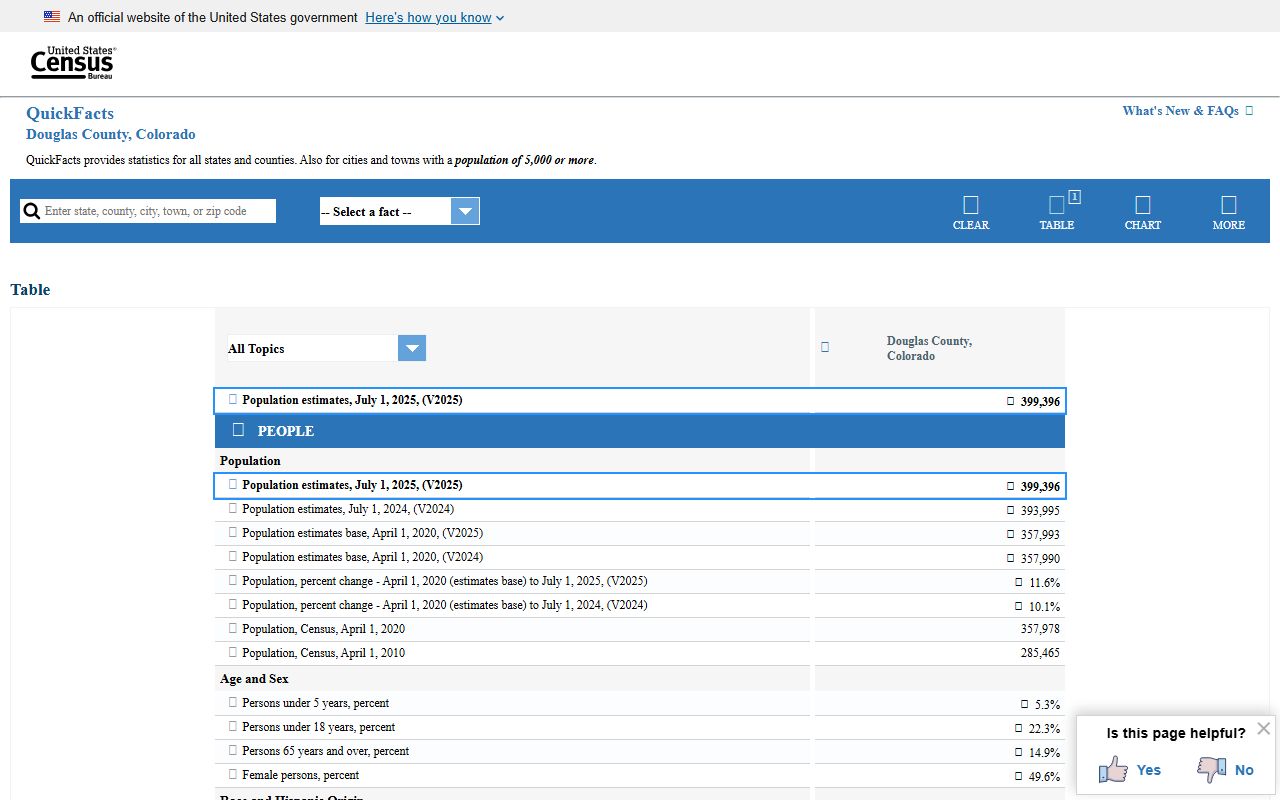
The Census page gives the recent population estimate that pairs with Sheriff ADP to compute a local rate.
Searching for Douglas County Inmate Records by Name
This page covers aggregate Douglas County jail population data. It does not look up a single person by name. Name based searches of the live jail roster live on the Douglas County inmate records page, which points to the Sheriff's public inmate inquiry portal and explains what fields and result data the portal returns.
Where the Data Comes From
Three source tiers feed this page. The first tier is the Douglas County Sheriff. The Sheriff's detention demographic statistics page is the official local source for any current Douglas County jail chart, demographic table, or custody snapshot. The Sheriff homepage and records request page are the right channels for follow-up questions. Sheriff Darren Weekly leads the office and the detention bureau that runs the facility.
The second tier is the Bureau of Justice Statistics. BJS publishes the national jail inmate reports and the state-level counts that frame any local figure. BJS also sets the standard terms used here: rated capacity, average daily population, confined population, admissions, and releases.
Lead-in for the Sheriff demographic image below: the Sheriff's detention demographic statistics page is the home for the local Douglas County jail population chart.
The Sheriff page is the first stop for any current Douglas County jail population figure cited on this page.
The third tier is local government source material. Douglas County budget documents and Sheriff annual reports cover bed counts, funding, and program costs that touch jail population. Court case mix data from the Colorado Judicial Branch for the 23rd Judicial District gives a side view of the case load that drives bookings.